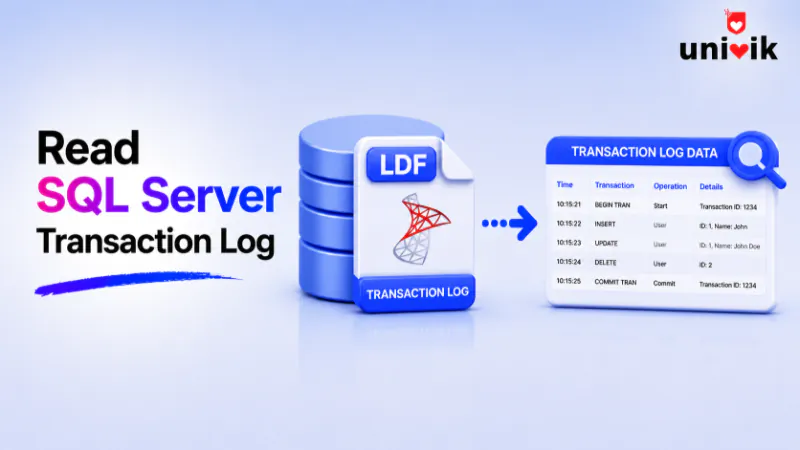
SQL Server has no supported log viewer, so reading the transaction log means the undocumented function fn_dblog. Run SELECT * FROM fn_dblog(NULL, NULL) in the database you want to read, and it returns every record in the active log. The columns tell you the operation, the table, the time and the transaction. To read a copied database file off the live server instead, Univik SQL Database Recovery opens it with no SQL Server attached.
The transaction log records every change SQL Server makes to a database, every insert, update, delete and schema change, in the order it happened. Reading it directly answers questions nothing else can, what a transaction actually did, when it ran and in what sequence. There is a catch worth knowing up front. Microsoft never built a supported tool to read the log, so the job falls to undocumented functions that are powerful, cryptic and easy to misuse. This page shows how to read the log with them, what the output means and where the honest limits are.
What the Transaction Log Holds
To see what is inside the log, a free SQL LDF viewer reads the SQL Server transaction log without SQL Server.
Every SQL Server database has a transaction log, the LDF file beside the MDF. Before the engine changes any data it writes a description of the change to the log first, a design called write ahead logging, so the log holds the record of a change before the data file ever does. That record includes what changed, which internal structure it touched and which transaction it belonged to. The log is what lets SQL Server roll a transaction back, recover after a crash and ship changes to a replica.
One point of confusion is worth clearing first. The transaction log is not the SQL Server error log. The error log is a text file of server messages that you read in Management Studio under Management, SQL Server Logs, and it says nothing about data changes. The transaction log is the LDF file, and reading it needs the functions on this page. To find the LDF for a database, query sys.database_files and filter to the log type, which returns its name and physical path.
For anyone reading it after the fact, that same detail is the value. The log is the one place that holds the history of actions rather than just the current state of the data. It does not store a tidy list of the SQL statements people ran, it stores the low level operations those statements produced, which is why reading it takes a little decoding. That decoding is what the rest of this page is about.

“Transaction log reading is tested on LDF files from databases we changed on purpose, so we know what the log should contain. Every SQL Server version and edition gets its own environment for this, because log formats differ by version.”
Nick Rogers
|Founder, Univik, building file conversion tools since 2013
Read the Log with fn_dblog
The function that reads the active log is fn_dblog. It takes two parameters, a starting log sequence number and an ending one, and passing NULL for both returns everything in the active log. Run it inside the database you want to read, not master, or you will read the wrong log.
- Connect to the database in question with
USE YourDatabase. - Run
SELECT * FROM fn_dblog(NULL, NULL)to return the full active log. - Narrow the columns to the ones that matter, since the raw output runs to around 130 of them.
- Filter with a WHERE clause on Operation or AllocUnitName to find the activity you care about.
A focused query reads far better than the raw dump. Selecting the handful of useful columns and filtering to the operations you want turns a wall of records into something legible, for example the inserts, updates and deletes tied to their transaction boundaries. The two NULL parameters are the usual starting point, and narrowing the log sequence number range comes later, once you know which part of the log you are after. On SQL Server 2017 and up a sibling function, fn_full_dblog, returns the same result set if you ever see it referenced.
[Transaction Name], [AllocUnitName], [Begin Time]
FROM fn_dblog(NULL, NULL)
WHERE Operation IN (‘LOP_INSERT_ROWS’, ‘LOP_MODIFY_ROW’, ‘LOP_DELETE_ROWS’)
The Columns Worth Reading
fn_dblog returns around 130 columns and most of them are internal noise for everyday reading. A small set carries the meaning, and knowing these turns the output from cryptic to useful.
Two of these deserve a note. AllocUnitName is how you filter to a single table, since it names the object each record touched, so a WHERE clause on it cuts the log down to the activity you actually want. And the Transaction SID, the login behind a transaction, sits only on the begin record for that transaction, not on every row, which is why tracing who ran something means finding the begin record first. Turning that SID into a login name, and the full method for pinning an action to a person, is the subject of our guide to SQL Server forensic analysis.
The Operations You See in the Log
The Operation column speaks in the engine’s own vocabulary, not in SQL statements. A single DELETE that removed ten rows shows as ten row removal operations wrapped between a transaction begin and a transaction commit. Learning the handful of common operation names is most of what it takes to read the log fluently.
Finding a specific event follows a simple shape. Filter on the operation, note the Transaction ID it belongs to, then pull every record with that same Transaction ID to see the whole transaction in order. A dropped table shows a Transaction Name of DROPOBJ, a delete shows LOP_DELETE_ROWS against the table’s AllocUnitName, and each one leads back to its begin record. Getting back what a delete removed is its own task, handled in the recovering deleted records guide. A dropped table has its own route in recovering a dropped table.
Active Log Versus the Inactive Part
fn_dblog sees the active log alone, the stretch running from the oldest open transaction up to the newest record. That is the single most important limit to understand, because the active portion is not the whole history. A log backup, a checkpoint or the simple recovery model all mark older transactions inactive and clear them, and once they are gone fn_dblog cannot see them. Run a full backup and the row count from fn_dblog drops sharply, that is the inactive part being flushed.
There is one override. Trace flag 2537 tells fn_dblog to read the whole log file rather than just the active part, so inactive records still physically present in the file come back into view. It is a lab tool, not a production habit, and it does not resurrect records that a backup has truly cleared. When the history you need has already left the active log, the route is the log backups, which is the next function.
Reading Log Backups with fn_dump_dblog
fn_dblog has a sister function, fn_dump_dblog, that reads a transaction log backup or a detached log rather than the active log. This is how you reach history that has already aged out of the active portion, as long as log backups exist. The trade is awkwardness, the function takes 63 parameters and every one has to be supplied, though you can pass DEFAULT for nearly all of them and only fill in the backup path.
Reading backups this way is slow, so a common pattern is to dump the output into a temporary table once, index it, then query that table as much as you like. fn_dump_dblog also drives point in time recovery through the STOPBEFOREMARK option, which restores a database to the instant just before a bad transaction. That recovery procedure is its own task, set out in our guide to recovering a SQL database without a backup. This page stays on reading the log rather than restoring from it.
Other Built in Ways to Read the Log
fn_dblog is the practical choice, but it is not the only built in way in. Two older commands come up enough to be worth placing.
DBCC LOG names the same territory but returns far less. It shows log records without telling you which object they touched, so for reading real activity it falls short of fn_dblog and mostly survives as a historical footnote. DBCC PAGE goes the other direction, it dumps the raw bytes of a single page, log or data, and needs trace flag 3604 set first so the output lands in the results window. It is a deep troubleshooting instrument for looking at one page’s contents, not a way to read the log as a stream of activity. For the ordinary job of reading what changed, fn_dblog is the tool, with fn_dump_dblog for the backups.
Read the file without wrestling the functions
The native functions are unsupported and cryptic. Univik SQL Database Recovery opens a copied database file on Windows with no SQL Server attached, so you can read what it holds without touching the live server.
Permissions, Risks and Honest Limits
Reading the log with these functions comes with real conditions, and skipping them is how people get hurt. fn_dblog requires sysadmin rights, and the giveaway when you lack them is a SELECT permission was denied error on the function. The functions are undocumented, which means Microsoft does not support them and can change or remove them in any version, so nothing here belongs in production code that has to keep working.
The honest limit sits underneath all of it. One limit catches people out above all the rest. The log records the change itself, not a tidy before and after. An update that changed a name from House to Mouse may show only the bytes that differed, and rebuilding the full old and new values means decoding the RowLog Contents columns and, for a column’s history, walking every change back to the original insert. It is possible, but it is painstaking. These functions were built for SQL Server’s own use, not for people, so the output is dense, the row counts run to millions on a busy database and reading a real answer out of it is slow work. On a live server that is unsupported and risky, on a copied file it is safe but still cryptic. A reader that opens a copied database file directly, the approach behind opening an MDF without SQL Server, gives a readable view of what the file holds without any of the production risk. The free MDF Viewer opens a copy read only for a first look.
Frequently Asked Questions
How do I Read a SQL Server Transaction Log?
Run the undocumented function fn_dblog inside the database you want to read. SELECT * FROM fn_dblog(NULL, NULL) returns the whole active log, and narrowing the columns and filtering on Operation or AllocUnitName makes the output readable. SQL Server has no supported log viewer, so fn_dblog is the built in route.
What Does fn_dblog Do?
fn_dblog pulls the active part of a database’s transaction log back as rows. It takes a start and end log sequence number, and passing NULL for both gives you everything in the active log. It exposes around 130 columns, of which the operation, the table, the transaction and the time are the ones worth reading.
Why is fn_dblog not Showing Older Transactions?
Because fn_dblog sees only the active part of the log. A log backup, a checkpoint or the simple recovery model clears older transactions from the active part, and once cleared they are gone from fn_dblog’s view. Trace flag 2537 widens it to inactive records still in the file, and log backups read through fn_dump_dblog reach history that has left the active log.
Can I Read a Transaction Log Backup?
Yes, with fn_dump_dblog, the sister function that reads a log backup or a detached log rather than the active log. It takes 63 parameters, so pass DEFAULT for most and supply the backup path. Reading is slow, so dumping the output into an indexed temporary table first makes repeated queries far quicker.
Do I Need Special Permissions to Read the Log?
Yes, fn_dblog requires sysadmin rights. Without them you get a SELECT permission was denied error on the function. These functions are also undocumented and unsupported, so treat them as lab and investigation tools rather than anything to build into an application that has to keep working across versions.
Is it Safe to Run fn_dblog on a Production Server?
With care. Reading the active log with NULL parameters is safe enough, but passing incorrect log sequence numbers can crash the instance and freeze it for minutes. The safe habit is to test on a restored copy first, and where the goal is just to read a database file, a reader that opens a copy off the live server avoids the risk entirely.