No Power BI connector exists for Marg's table files.
Export the company as CSV for flat tables or as a single JSON file, then load the result with Get Data. Use the Folder connector for many companies and set the locale on date columns. Keep company and year in every join key and compare one total with a printed report.
A dashboard needs flat tables and Marg gives you printed reports, and the gap between the two is where most analysts lose a week. Files are the bridge. A few Power Query settings then decide whether the numbers tie or whether you spend Friday afternoon hunting for a date that flipped.
Who Builds Dashboards from Marg Books?
Choose the line that sounds like your job.
You export report after report and still cannot slice by month and party in one view.
See why →You have both CSV and JSON on offer and you want whichever one costs you less cleanup in Power Query.
Compare the formats →One dashboard should show several companies or years side by side.
Combine the files →Marg is strong at day-to-day entry and printed reports, but dashboards are a different job. They need flat tables that a model can join. The route below turns a company into files that Power BI already understands and then joins them without a mismatch.
Why Does Marg Data Not Load into Power BI Directly?
Marg keeps each table in its own file inside the Data folder, and Power BI has no connector for them. The usual fallback is the report export, but a Techjockey user thread says Marg sends a single report to Excel per run. A year of analysis then means dozens of runs and a pile of workbooks to stitch.
Limitations of the report route: one report per run, a layout shaped by the report and not by the data and no way to include deleted records.
The practical answer is to stop looking for a connector and write the whole company to a format the tool already reads. Our guide on exporting Marg data to Excel covers the workbook route.
Which Suits Marg Data Better: CSV or JSON?
Both work. They differ in shape, and the converter can produce both from one company, so test each on the same data and stay with the one that suits you.
Which one? CSV when you want the shortest Power Query, JSON when one file per company should hold every table. Unsure? Begin with CSV and switch later, since the data inside is the same.
| CSV | JSON | |
|---|---|---|
| Shape | One flat file per table | Nested records in a file |
| Power BI step | Get Data, Text/CSV | Get Data, JSON, then expand |
| Rework | Set types and locale | Expand records and lists |
| Best for | Most dashboards | Scripts and databases |
| Many files | Folder connector | One file at a time |
Microsoft documents both paths. The text and CSV import page covers the first and the structured column page covers expanding records, lists and tables.
How to Load Marg Data into Power BI Step by Step
- Export the companyProduce CSV when you want flat tables. Produce JSON when you want a single file. Use a date filter when you only need one year.
- Open Power BI DesktopStart a blank report and open Get Data. Use Text/CSV for a single file. Use JSON for the JSON file. Use Folder when you have many files.
- Filter to one tableIn a folder list, keep only the file names for the table you want. Then choose Combine and Transform Data.
- Fix the column typesSet the date column with the right locale. Set amounts to decimal numbers and keep codes as text.
- Add company and year to the keyThe same code can repeat across companies. Keep the file or folder name and use it in every join.
- Relate the tables and check one totalJoin ledger entries to accounts. Compare one month with a printed Marg report before you publish.
Note: we have not fixed one layout for every export. Open the first CSV in a text editor and note the date order and the delimiter, then set the locale and types once and reuse the query for every file.

How Do You Combine Many Marg Companies or Years?
Put each export in a folder and point the Folder connector at the parent. Microsoft's folder import page explains the Combine step and says the files must share column headers, which is the one rule that breaks most combines.
| Step | What to do | Why |
|---|---|---|
| Filter | Keep file names for one table | Combine needs identical headers |
| Tag | Keep the source name as a column | Codes can repeat between companies |
| Type | Apply one locale to dates | Day-first dates read wrongly otherwise |
| Join | Use company and code together | Avoids mixing two companies |
If dates look swapped, set the locale on the column. Microsoft shows how on its locale page. If special characters look broken, read the UTF-8 note.
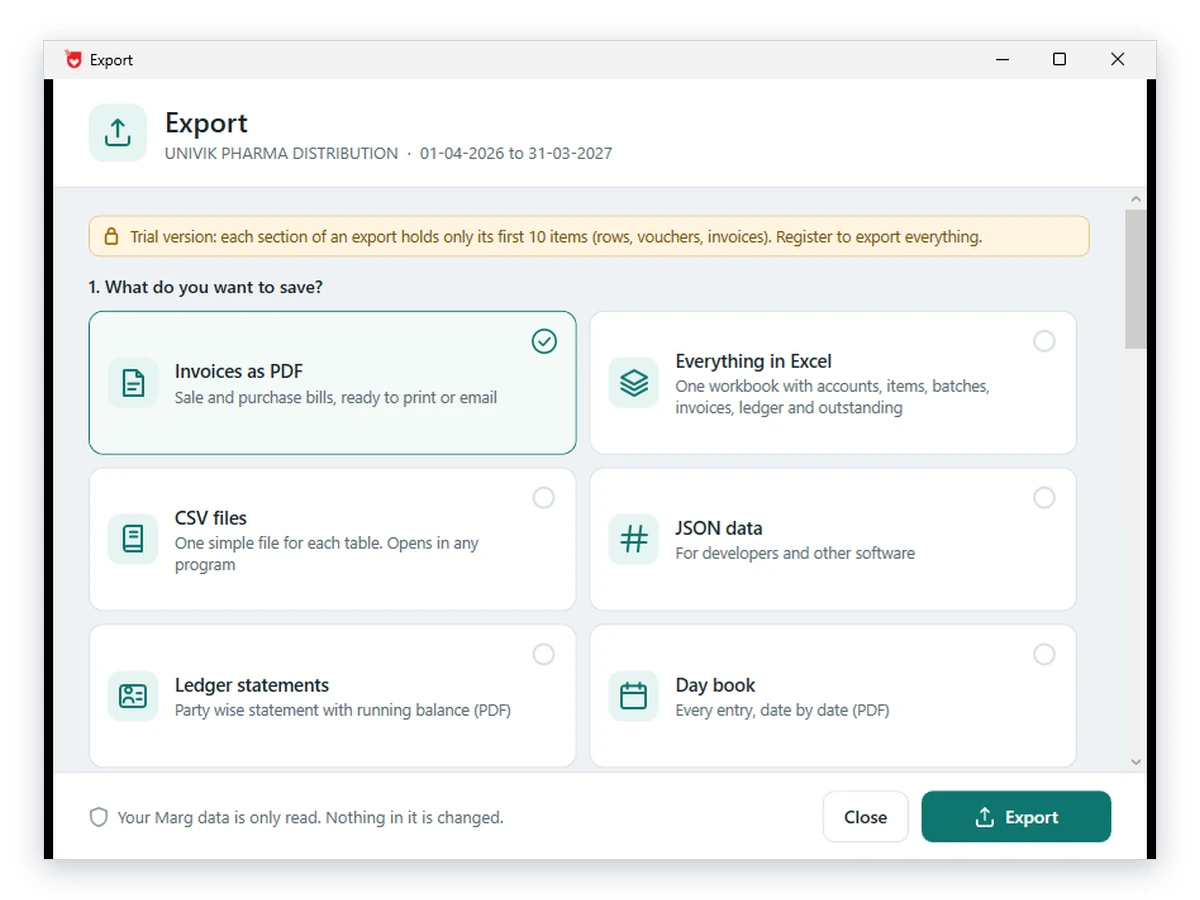
Univik Marg Data Converter turns a company into plain tables that a model can join. Date and voucher filters apply to them.
Group totals equalled the sum of group month postings in 100% of our test rows, across month balance tables of 1,241, 4,313 and 33,261 rows in three real companies. That last one is the size that makes Power BI worth the setup.
Download Free Trial Unlock Saving - From $99Use it on Windows 11 or 10. Free copies save ten items for each section. Converter page
- One month's sales total matches a printed Marg report
- Cash and bank balances match at the same date
- Row counts per table match across two exports of the same data
- Dates read in the right order on a visual
- Every join uses company plus code
Fix Common Power BI Load Problems
Do this: The locale does not match the file. Set it on the column the way Microsoft shows. Then reload.
Do this: Two files have different columns. Filter the folder to one table and remove stray files.
Do this: Re-open the file as UTF-8 in the import dialog.
Do this: Check your date filter and whether deleted rows were included. The deleted entries guide explains why deleted rows can remain in the files.
Need help with a file layout? Contact our support team and attach the first few rows.
Questions About Marg Data in Power BI

Univik staff gave product input. The Power Query steps come from Microsoft Support pages read on October 12, 2026. The layout advice is ours.
Pages we read: Microsoft folder import · Microsoft locale · Microsoft structured columns · Microsoft UTF-8 CSV